The most commonly quoted statistic provided to “prove” that racial profiling was occurring in Ferguson, Mo., was this: “While only 67% of Ferguson’s populace is black, stops of black motorists accounted for 86% of all stops by Ferguson Police.”
We’d like you to consider this statement. Unless you believe that the only people driving in Ferguson are those who live in Ferguson, that statistic is at best the result of a poor understanding of both statistics and policing.
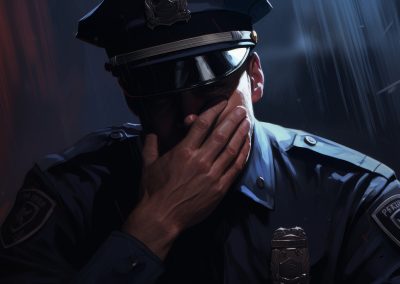
Statistical analysis of policing and traffic stops is a highly complex activity. We stand at one of the most important points in race relations and law and order in our nation’s history, yet sound-byte quality bad statistics are being bandied about by national leaders and press. It would be a shame to squander this opportunity for want of some college-freshman-level statistics and civics.
What We Can Say
Without debating whether Ferguson police engaged in racial profiling—we don’t know, and neither do you—we can speak to accepted statistical validity. We’re not scientists or statisticians ourselves. But we do run companies that analyze security, Internet and law enforcement data, and we have mathematicians, statisticians and data scientists on staff and on our board of advisors.
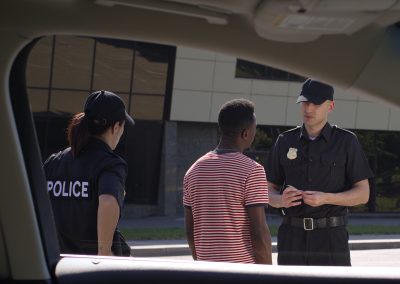
Cops don’t look to the census bureau for people to pull over—they pull over people who are in the area the cops are looking in.
In reviewing the court data for a city in Texas, for example, we found that just about 80% of all the stops in the city in the last year were of residents of 24 zip codes, of which 17 were located outside the city limits. A racial compositional analysis of those 24 zip codes provides us a weighted racial composition of 26.7% black residents, 57.7% white residents, and 15.6% residents who are neither black nor white (such as Hispanic, Asian Pacific Islanders, Asian, etc.). The combined population is 749,000.
The latest census figures for the city itself show a markedly different racial composition: 18.8% black, 59.0% white and 28.3 other, in a population of 379,000.
The interesting thing about this analysis is not that the city has more than a third more black daily population than “official” residents—this is not surprising: the city is a big commuter destination—but rather that so few people notice that the important metric isn’t “who lives here?” but rather: “Who is driving on this road while the police are patrolling it?”
It would be very difficult to get a racial composition of who is on a given highway at a given time in a manner acceptable both legally and socially. But there are common sense questions that can and must be asked to highlight outliers. We’d first need to understand the times of day when, and the streets on which, officers stop the most and fewest people and cars. That’s key. Traffic on a highway at 2 a.m. comprises different kinds of people engaged in different kinds of activities from traffic on the same highway at 4 p.m.
It’s equally important to understand where the stops are made. Stops made along an interstate or a state or county highway yield a different population than stops made on Main Street or on residential streets within the city.
Even with this cursory level of digging, and we could go many steps further, it’s obvious that categories may be drawn. It is unfair to call racist an officer (who may be black or white) who patrols in a predominantly black community on the basis that most of his stops are of black people. It’s equally unfair to the community to ignore the fact that an officer (who may be black or white) is stopping mainly black people in a predominantly white neighborhood.
Asking questions of the data allows you to account for these discrepancies, and to dig into the question we all have: Are our police treating us fairly?
Conclusion
That’s the question on which we should focus. The answer lies in objective looks at the data, by experts in the field of law enforcement and statistics. The resultant answers can be the basis of a substantive national discussion, anchored firmly in a factual understanding of what we do know.
Anything short of that is just two groups hurling invective—and that squanders this precious opportunity to make things better.


0 Comments